Multiple Moving AverageSuper simple script integrating three moving averages within only one script. It's going to help you to keep your chart cleaner while saving two spots for other indicators you may like. Try it out and let me know what you think.
A possible trading strategy:
Buy/Sell crossover of the MAs. Buy/Sell when fast MA crosses medium MA, double down when medium MA crosses slow MA.
Combining trading strategy is always a good idea.
Cari dalam skrip untuk "ma cross"
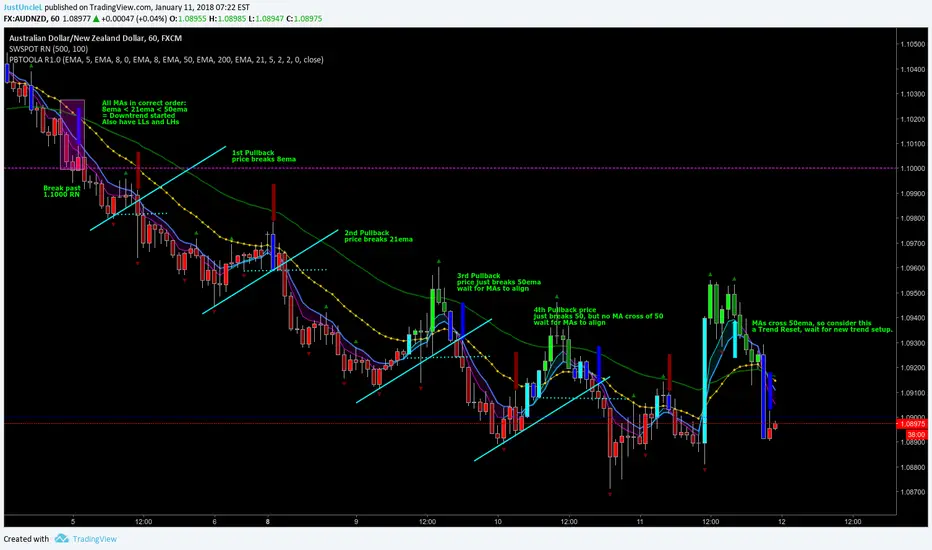
Pullback Trading Tool ALT R1.0 by JustUncleLThis study is an alternative Pullback Tool to my previous versions "Pullback Trading Tool R#.# by JustUncleL". This version aims to provide a cleaner but powerful trading tool. It incorporates the majority of the indicators needed to analyse trade Trends for Pullbacks and Reversals. You can optionally use Heikin Ashi candle or Renko charts. The notes here are mainly in reference to using standard Candlestick 60min signal chart (or Anchor chart time frame), other higher time frames can be used instead as Anchor Time Frames such as 240min(4hr) or 1440min(Daily).
NOTE: A Pullback is synomous to Retracement, generally a Pullback refers to a large Retracement of 100pips or more. In the context of this Tool and any comments related to it, a Pullback will be the same as a Retracement.
Incorporated within this tool are the following indicators:
1. Three Moving Averages (EMA by default) that can optionally be Anchored to a Higher Time Frame:
DodgerBlue = EMA08 (default)
Green = EMA50 (default)
Gray = EMA200 (default), disabled by default.
2. One Anchored Signal Moving Average line Yellow EMA21 (default).
3. Two Un-Anchored Moving Averages as Ribbon, can be disabled.
Aqua = EMA03 (default)
Fuchsia = EMA08 (default)
4. Display Pivots and optional Pivot Levels. By default Pivot is set to : 2 candles RHS of Pivot and 2 candles LHS of Pivot; this is the setting required to show standard Fractal points.
5. Optional HH, LH, LL, HL finder to help with drawing Trend lines and mini Trend Lines.
6. Coloured coded Bar based on the signal MA:
the Standard candle colours:
Blue = candle open and closed above signal MA.
Red = candle open and closed below signal MA.
Yellow = Candle stradle across signal MA.
the Grab candles scheme:
Lime = Bull candle open and closed above signal MA.
Green = Bear candle open and closed above signal MA.
Red = Bull candle open and closed below signal MA.
DarkRed = Bear candle open and closed below signal MA.
Aqua = Bull candle closed across signal MA.
Blue = Bear candle stradle across signal MA.
7. Alert entry arrows generated within a Trend or at the start of a new trend.
An Uptrend is defined as anchored fast (8ema) above anchored signal (21ema) above anchored medium (50ema).
A Downtrend is defined as anchored fast (8ema) below anchored signal (21ema) below anchored medium (50ema).
A Pullback generates an red (short entry) or green (long entry) arrow when price crosses anchored fast or signal MAs and then crosses back to return to trend direction.
A Trend Break, which is defined as any of the MAs crossing breaking trend, generates a blue (short) or aqua (long) arrow and then make new trend (in same or new trend direction).
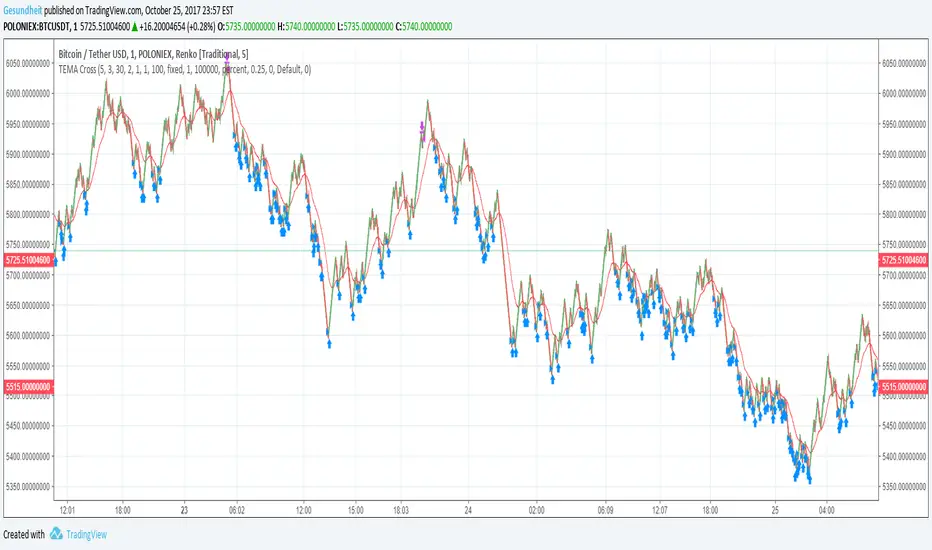
TEMA Cross on Renko CandlesRenko candles filter out noise by plotting a fixed change in price rather than a fixed time frame.
Strategies like MACD or MA cross can give a lot of false signals when the price is wavy, but not actually going anywhere. This is especially a problem with small time frames.
Since it's so easy to identify trends on a Renko plot, this strategy uses a simple moving average cross idea. Instead of an EMA, we use a TEMA ( triple exponential moving average ) because that version does not lag as much.
We also will avoid buying when the price is above a longer-term smoothed moving average. This means we will hopefully reduce bags, but we will also miss some trades.
Also included are
avg_protection -- if >0 only buy when it will bring down our average price, else buy whenever the TEMA crosses over the short-term SMA
gain_protection -- if >0 only sell when we meet out min_gain %, otherwise sell whenever TEMA crosses under the short-term SMA
I've been setting my Renko candles to a fixed range instead of ATR, and I use increments of roughly 0.1% in the example chart.
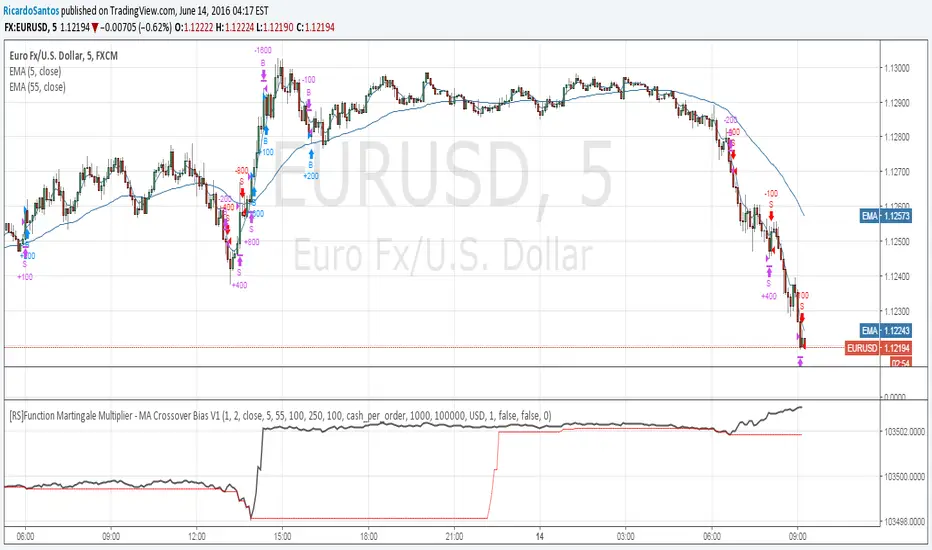
[RS]Function Martingale Multiplier - MA Crossover Bias V1EXPERIMENTAL:
WARNING: Martingale is subject to HUGE drawdown spikes, use at your own risk!
updated function to also double(aply multiplier) on even trades, example with a MA's crossover.
Simple MA Crossover w/ SLTPPicture two cheetahs on a racetrack made of price candles. One cheetah is fast and twitchy (the short-term EMA). The other is chill, lumbering, and takes its sweet time (the long-term EMA). When the twitchy cheetah sprints ahead and crosses above the chill one → “BUY, YOU MAGNIFICENT DEGEN!” When the twitchy one gets tired, slows down, and gets lapped from above → “SELL before this turns into a horror movie!”
That, my friend, is the EMA crossover strategy in its purest, most dramatic form.

Smart Money Concepts [XoRonX]# Smart Money Concepts (SMC) - Advanced Trading Indicator
## 📊 Deskripsi
**Smart Money Concepts ** adalah indicator trading komprehensif yang menggabungkan konsep Smart Money Trading dengan berbagai alat teknikal analisis modern. Indicator ini dirancang untuk membantu trader mengidentifikasi pergerakan institusional (smart money), struktur pasar, zona supply/demand, dan berbagai sinyal trading penting.
Indicator ini mengintegrasikan multiple timeframe analysis, order blocks detection, fair value gaps, fibonacci retracement, volume profile, RSI multi-timeframe, dan moving averages dalam satu platform yang powerful dan mudah digunakan.
---
## 🎯 Fitur Utama
### 1. **Smart Money Structure**
- **Internal Structure** - Struktur pasar jangka pendek untuk entry presisi
- **Swing Structure** - Struktur pasar jangka panjang untuk trend analysis
- **BOS (Break of Structure)** - Konfirmasi kelanjutan trend
- **CHoCH (Change of Character)** - Deteksi potensi reversal
### 2. **Order Blocks**
- **Internal Order Blocks** - Zona demand/supply jangka pendek
- **Swing Order Blocks** - Zona demand/supply jangka panjang
- Filter otomatis berdasarkan volatilitas (ATR/Range)
- Mitigation tracking (High/Low atau Close)
- Customizable display (jumlah order blocks yang ditampilkan)
### 3. **Equal Highs & Equal Lows (EQH/EQL)**
- Deteksi otomatis equal highs/lows
- Indikasi liquidity zones
- Threshold adjustment untuk sensitivitas
- Visual lines dan labels
### 4. **Fair Value Gaps (FVG)**
- Multi-timeframe FVG detection
- Auto threshold filtering
- Bullish & Bearish FVG boxes
- Extension control
- Color customization
### 5. **Premium & Discount Zones**
- Premium Zone (75-100% dari range)
- Equilibrium Zone (47.5-52.5% dari range)
- Discount Zone (0-25% dari range)
- Auto-update berdasarkan swing high/low
### 6. **Fibonacci Retracement**
- **Equilibrium to Discount** - Fib dari EQ ke discount zone
- **Equilibrium to Premium** - Fib dari EQ ke premium zone
- **Discount to Premium** - Fib full range
- Reverse option
- Show/hide lines
- Custom colors
### 7. **Volume Profile (VRVP)**
- Visible Range Volume Profile
- Point of Control (POC)
- Value Area (70% volume)
- Auto-adjust rows
- Placement options (Left/Right)
- Width customization
### 8. **RSI Multi-Timeframe**
- Monitor 3 timeframes sekaligus
- Overbought/Oversold signals
- Visual table display
- Color-coded signals (Red OB, Green OS)
- Customizable position & size
### 9. **Moving Averages**
- 3 Moving Average lines
- Pilihan tipe: EMA, SMA, WMA
- Automatic/Manual period mode
- Individual color & width settings
- Cross alerts (MA vs MA, Price vs MA)
### 10. **Multi-Timeframe Levels**
- Support up to 5 different timeframes
- Previous high/low levels
- Custom line styles
- Color customization
### 11. **Candle Color**
- Color candles berdasarkan trend
- Bullish = Green, Bearish = Red
- Optional toggle
---
## 🛠️ Cara Penggunaan
### **A. Setup Awal**
1. **Tambahkan Indicator ke Chart**
- Buka TradingView
- Klik "Indicators" → "My Scripts" atau paste code
- Pilih "Smart Money Concepts "
2. **Pilih Mode Display**
- **Historical**: Tampilkan semua struktur (untuk backtesting)
- **Present**: Hanya tampilkan struktur terbaru (clean chart)
3. **Pilih Style**
- **Colored**: Warna berbeda untuk bullish/bearish
- **Monochrome**: Tema warna abu-abu
---
### **B. Penggunaan Fitur**
#### **1. Smart Money Structure**
**Internal Structure (Real-time):**
- ✅ Aktifkan "Show Internal Structure"
- Pilih tampilan: All, BOS only, atau CHoCH only
- Gunakan untuk entry timing presisi
- Filter confluence untuk mengurangi noise
**Swing Structure:**
- ✅ Aktifkan "Show Swing Structure"
- Pilih tampilan struktur bullish/bearish
- Adjust "Swings Length" (default: 50)
- Gunakan untuk konfirmasi trend utama
**Tips:**
- BOS = Konfirmasi trend continuation
- CHoCH = Warning untuk possible reversal
- Tunggu price retest ke order block setelah BOS
---
#### **2. Order Blocks**
**Setup:**
- ✅ Aktifkan Internal/Swing Order Blocks
- Set jumlah blocks yang ditampil (1-20)
- Pilih filter: ATR atau Cumulative Mean Range
- Pilih mitigation: Close atau High/Low
**Cara Trading:**
1. Tunggu BOS/CHoCH terbentuk
2. Identifikasi order block terdekat
3. Wait for price pullback ke order block
4. Entry saat price respek order block (rejection)
5. Stop loss di bawah/atas order block
6. Target: swing high/low berikutnya
**Color Code:**
- 🔵 Light Blue = Internal Bullish OB
- 🔴 Light Red = Internal Bearish OB
- 🔵 Dark Blue = Swing Bullish OB
- 🔴 Dark Red = Swing Bearish OB
---
#### **3. Equal Highs/Lows (EQH/EQL)**
**Setup:**
- ✅ Aktifkan "Equal High/Low"
- Set "Bars Confirmation" (default: 3)
- Adjust threshold (0-0.5, default: 0.1)
**Interpretasi:**
- EQH = Liquidity di atas, kemungkinan sweep lalu dump
- EQL = Liquidity di bawah, kemungkinan sweep lalu pump
- Biasanya smart money akan grab liquidity sebelum move besar
**Trading Strategy:**
- Wait for EQH/EQL formation
- Anticipate liquidity grab
- Entry setelah sweep dengan konfirmasi (order block, FVG, CHoCH)
---
#### **4. Fair Value Gaps (FVG)**
**Setup:**
- ✅ Aktifkan "Fair Value Gaps"
- Pilih timeframe (default: chart timeframe)
- Enable/disable auto threshold
- Set extension bars
**Cara Trading:**
1. Bullish FVG = Support zone untuk buy
2. Bearish FVG = Resistance zone untuk sell
3. Price tends to fill FVG (retest)
4. Entry saat price kembali ke FVG
5. Partial fill = valid, full fill = invalidated
**Tips:**
- FVG + Order Block = High probability setup
- Multi-timeframe FVG lebih kuat
- Unfilled FVG = strong momentum
---
#### **5. Premium & Discount Zones**
**Setup:**
- ✅ Aktifkan "Premium/Discount Zones"
- Zones akan auto-update berdasarkan swing high/low
**Interpretasi:**
- 🟢 **Discount Zone** = Area BUY (price murah)
- ⚪ **Equilibrium** = Neutral (50%)
- 🔴 **Premium Zone** = Area SELL (price mahal)
**Trading Strategy:**
- BUY dari discount zone
- SELL dari premium zone
- Avoid trading di equilibrium
- Combine dengan structure confirmation
---
#### **6. Fibonacci Retracement**
**Setup:**
- Pilih Fib yang ingin ditampilkan:
- Equilibrium to Discount
- Equilibrium to Premium
- Discount to Premium
- Toggle show lines
- Enable reverse jika perlu
- Custom colors
**Key Levels:**
- 0.236 = Shallow retracement
- 0.382 = Common retracement
- 0.5 = 50% golden level
- 0.618 = Golden ratio (penting!)
- 0.786 = Deep retracement
**Cara Pakai:**
- 0.618-0.786 = Ideal entry zone dalam trend
- Combine dengan order blocks
- Wait for confirmation candle
---
#### **7. Volume Profile (VRVP)**
**Setup:**
- ✅ Aktifkan "Show Volume Profile"
- Set jumlah rows (10-100)
- Adjust width (5-50%)
- Pilih placement (Left/Right)
- Enable POC dan Value Area
**Interpretasi:**
- **POC (Point of Control)** = Harga dengan volume tertinggi = magnet
- **Value Area** = 70% volume = fair price range
- **Low Volume Nodes** = Weak support/resistance
- **High Volume Nodes** = Strong support/resistance
**Trading:**
- POC acts as support/resistance
- Price tends to return to POC
- Breakout dari Value Area = momentum
---
#### **8. RSI Multi-Timeframe**
**Setup:**
- ✅ Aktifkan "Show RSI Table"
- Set 3 timeframes (default: chart, 5m, 15m)
- Set RSI period (default: 14)
- Set Overbought level (default: 70)
- Set Oversold level (default: 30)
- Pilih posisi & ukuran table
**Interpretasi:**
- 🟢 **OS (Oversold)** = RSI ≤ 30 = Kondisi jenuh jual
- 🔴 **OB (Overbought)** = RSI ≥ 70 = Kondisi jenuh beli
- **-** = Neutral zone
**Trading Strategy:**
1. Multi-timeframe alignment = strong signal
2. OS + Bullish structure = BUY signal
3. OB + Bearish structure = SELL signal
4. Divergence RSI vs Price = reversal warning
**Contoh:**
- TF1: OS, TF2: OS, TF3: OS + Price di discount zone = STRONG BUY
---
#### **9. Moving Averages**
**Setup:**
- Pilih MA Type: EMA, SMA, atau WMA (berlaku untuk ketiga MA)
- Pilih Period Mode: Automatic atau Manual
- Set period untuk MA 1, 2, 3 (default: 20, 50, 100)
- Custom color & width per MA
- ✅ Enable Cross Alerts
**Interpretasi:**
- **Golden Cross** = MA fast cross above MA slow = Bullish
- **Death Cross** = MA fast cross below MA slow = Bearish
- Price above all MAs = Strong uptrend
- Price below all MAs = Strong downtrend
**Trading Strategy:**
1. MA1 (20) = Short-term trend
2. MA2 (50) = Medium-term trend
3. MA3 (100) = Long-term trend
**Entry Signals:**
- Price bounce dari MA dalam trend = continuation
- MA cross dengan konfirmasi structure = entry
- Multiple MA confluence = strong support/resistance
**Alerts Available:**
- MA1 cross MA2/MA3
- MA2 cross MA3
- Price cross any MA
---
#### **10. Multi-Timeframe Levels**
**Setup:**
- Enable HTF Level 1-5
- Set timeframes (contoh: 5m, 1H, 4H, D, W)
- Pilih line style (solid/dashed/dotted)
- Custom colors
**Cara Pakai:**
- Previous high/low dari HTF = strong S/R
- Breakout HTF level = significant move
- Multiple HTF levels confluence = major zone
---
### **C. Trading Setup Combination**
#### **Setup 1: High Probability Buy (Bullish)**
1. ✅ Swing structure: Bullish BOS
2. ✅ Price di Discount Zone
3. ✅ Pullback ke Bullish Order Block
4. ✅ Bullish FVG di bawah
5. ✅ RSI Multi-TF: Oversold
6. ✅ Price bounce dari MA
7. ✅ POC/Value Area support
8. ✅ Fibonacci 0.618-0.786 retracement
**Entry:** Saat price reject dari order block dengan confirmation candle
**Stop Loss:** Below order block
**Target:** Swing high atau premium zone
---
#### **Setup 2: High Probability Sell (Bearish)**
1. ✅ Swing structure: Bearish BOS
2. ✅ Price di Premium Zone
3. ✅ Pullback ke Bearish Order Block
4. ✅ Bearish FVG di atas
5. ✅ RSI Multi-TF: Overbought
6. ✅ Price reject dari MA
7. ✅ POC/Value Area resistance
8. ✅ Fibonacci 0.618-0.786 retracement
**Entry:** Saat price reject dari order block dengan confirmation candle
**Stop Loss:** Above order block
**Target:** Swing low atau discount zone
---
#### **Setup 3: Liquidity Grab (EQH/EQL)**
1. ✅ Identifikasi EQH atau EQL
2. ✅ Wait for liquidity sweep
3. ✅ Konfirmasi dengan CHoCH
4. ✅ Order block terbentuk setelah sweep
5. ✅ Entry saat retest order block
---
### **D. Tips & Best Practices**
**Risk Management:**
- Selalu gunakan stop loss
- Risk 1-2% per trade
- Risk:Reward minimum 1:2
- Jangan over-leverage
**Confluence adalah Kunci:**
- Minimal 3-4 konfirmasi sebelum entry
- Lebih banyak konfirmasi = higher probability
- Quality over quantity
**Timeframe Analysis:**
- HTF (Higher Timeframe) = Trend direction
- LTF (Lower Timeframe) = Entry timing
- Align dengan HTF trend
**Backtesting:**
- Gunakan mode "Historical"
- Test strategy di berbagai market condition
- Record dan analyze hasil
**Market Condition:**
- Trending market = Follow BOS, use order blocks
- Ranging market = Use premium/discount zones, EQH/EQL
- High volatility = Wider stops, wait for clear structure
**Avoid:**
- Trading di equilibrium zone
- Entry tanpa konfirmasi
- Fighting the trend
- Overleveraging
- Emotional trading
---
## 📈 Recommended Settings
### **For Scalping (1m - 5m):**
- Internal Structure: ON
- Swing Structure: OFF
- Order Blocks: Internal only
- RSI Timeframes: 1m, 5m, 15m
- MA Periods: 9, 21, 50
### **For Day Trading (15m - 1H):**
- Internal Structure: ON
- Swing Structure: ON
- Order Blocks: Both
- RSI Timeframes: 15m, 1H, 4H
- MA Periods: 20, 50, 100
### **For Swing Trading (4H - D):**
- Internal Structure: OFF
- Swing Structure: ON
- Order Blocks: Swing only
- RSI Timeframes: 4H, D, W
- MA Periods: 20, 50, 200
---
## ⚠️ Disclaimer
Indicator ini adalah alat bantu analisis teknikal. Tidak ada indicator yang 100% akurat. Selalu:
- Lakukan analisa fundamental
- Gunakan proper risk management
- Praktik di demo account terlebih dahulu
- Trading memiliki resiko, trade at your own risk
---
## 📝 Version Info
**Version:** 5.0
**Platform:** TradingView Pine Script v5
**Author:** XoRonX
**Max Labels:** 500
**Max Lines:** 500
**Max Boxes:** 500
---
## 🔄 Updates & Support
Untuk update, bug reports, atau pertanyaan:
- Check documentation regularly
- Test new features in replay mode
- Backup your settings before updates
---
## 🎓 Learning Resources
**Recommended Study:**
1. Smart Money Concepts (SMC) basics
2. Order blocks theory
3. Liquidity concepts
4. ICT (Inner Circle Trader) concepts
5. Volume profile analysis
6. Multi-timeframe analysis
**Practice:**
- Start with higher timeframes
- Master one concept at a time
- Keep a trading journal
- Review your trades weekly
---
**Happy Trading! 🚀📊**
_Remember: The best indicator is your own analysis and discipline._

7/21 EMA ADX Pro After many months (actually years) of intense research, countless hours of testing different approaches, and rigorous backtesting, I’ve finally developed this indicator/strategy based on moving average crossovers enhanced with power-based filtering to significantly reduce false signals and whipsaws. This is not just another basic MA crossover system. The core idea revolves around applying mathematical powers (exponents) to the moving averages and combining them with additional confirmation filters, creating a much more robust and reliable signal generation mechanism. I’m sharing it with the community in the hope that it can be useful to someone else who, like me, has spent endless nights trying to find an edge in the markets. Feel free to test it, modify it, or improve it. Feedback, suggestions, and constructive criticism are always welcome. If you find it helpful, a simple like or comment would mean a lot — it’s the result of a huge amount of work and passion. Happy trading! (Full Pine Script code will be posted below or in the next update — stay tuned!

Composite Sentiment Indicator (SPY/QQQ/SOXX + VixFix)# Multi-Index Composite Sentiment Indicator
A comprehensive sentiment indicator that works across SPY, QQQ, SOXX, and custom symbols. Combines volatility, options flow, macro factors, technicals, and seasonality into a single z-score composite.
## What It Does
Takes multiple market sentiment inputs (VIX, put/call ratios, breadth, yields, etc.) and smooshes them into one normalized line. When the composite is high = markets getting spooked. When it's low = markets getting complacent.
## Key Features
- **Multi-Index Support**: Automatically adapts for SPY (uses VIX), QQQ (uses VXN), SOXX (uses VixFix), or custom symbols
- **VixFix Integration**: Larry Williams' VixFix for indices without dedicated VIX measures
- **Signal MA**: Choose from SMA/EMA/WMA/HMA/TEMA/DEMA with color coding (red above MA = risk-on, green below = risk-off)
- **September Focus**: Built-in seasonality weighting for September weakness patterns
- **Comprehensive Components**: Volatility, options sentiment, macro factors, technicals, and sector-specific metrics
## How to Use
**Basic Setup:**
1. Pick your index (SPY/QQQ/SOXX)
2. Choose signal MA type and length (EMA 21 is a good start)
3. Watch for extreme readings and MA crossovers
**Color Signals:**
- Red composite = above signal MA = bearish sentiment
- Green composite = below signal MA = bullish sentiment
- Extreme high readings (red background) = potential tops
- Extreme low readings (green background) = potential bottoms
**For Different Indices:**
- **QQQ**: Uses NASDAQ VIX (VXN) when available, falls back to VixFix
- **SOXX**: Includes semiconductor cycle indicators, uses VixFix for volatility
- **Custom**: Adapts automatically, relies on VixFix and general market metrics
## Components Included
**Volatility**: VIX/VXN/VixFix, term structure, historical vol
**Options**: Put/call ratios, SKEW index
**Macro**: DXY, 10Y yields, yield curve, TIPS spreads
**Technical**: RSI deviation, momentum
**Seasonality**: September effects, quad witching, month-end patterns
**Breadth**: S&P 500 and NASDAQ breadth measures
## Pro Tips
- Works well on Daily Timeframe
- September gets extra weight automatically - watch for August setup signals
- Keltner envelope breaks often mark sentiment exhaustion points
- Use alerts for extreme readings and MA crossovers
Works best when you understand that sentiment extremes often mark turning points, not continuation signals. High readings don't mean "keep shorting" - they mean "start looking for reversal setups."
## Settings Worth Tweaking
- Signal MA type/length for your timeframe
- Component weights based on what matters for your index
- Envelope multipliers for your risk tolerance
- VixFix parameters if default doesn't fit your symbol's volatility
The table shows all current component readings so you can see what's driving the signal. Good for context and debugging weird readings.

SMI Base-Trigger Bullish Re-acceleration (Higher High)Description
What it does
This indicator highlights a two-step bullish pattern using Stochastic Momentum Index (SMI) plus an ATR distance filter:
1. Base (orange) – Marks a momentum “reset.” A base prints when SMI %K crosses up through %D while %K is below the Base level (default -70). The base stores the base price and starts a waiting window.
2. Trigger (green) – Confirms momentum and price strength. A trigger prints only if, before the timeout window ends:
• SMI %K crosses up through %D again,
• %K is above the Trigger level (default -60),
• Close > Base Price, and
• Price has advanced at least Min ATR multiple (default 1.0× the 14-period ATR) above the base price.
A dashed green line connects the base to the trigger.
Why it’s useful
It seeks a bullish divergence / reacceleration: momentum recovers from deeply negative territory, then price reclaims and exceeds the base by a volatility-aware margin. This helps filter out weak “oversold bounces.”
Signals
• Base ▲ (orange): Potential setup begins.
• Trigger ▲ (green): Confirmation—momentum and price agree.
Inputs (key ones)
• %K Length / EMA Smoothing / %D Length: SMI construction.
• Base when %K < (default -70): depth required for a valid reset.
• Trigger when %K > (default -60): strength required on confirmation.
• Base timeout (days) (default 100): maximum look-ahead window.
• ATR Length (default 14) and Min ATR multiple (default 1.0): price must exceed the base by this ATR-scaled distance.
How traders use it (example rules)
• Entry: On the Trigger.
• Risk: A common approach is a stop somewhere between the base price and a multiple of ATR below trigger; or use your system’s volatility stop.
• Exits: Your choice—trend MA cross, fixed R multiple, or structure-based levels.
Notes & tips
• Works best on liquid symbols and mid-to-higher timeframes (reduce noise).
• Increase Min ATR multiple to demand stronger price confirmation; tighten or widen Base/Trigger levels to fit your market.
• This script plots signals only; convert to a strategy to backtest entries/exits.

NY Opening Range Breakout - MA StopCore Concept
This strategy trades breakouts from the New York opening range (9:30-9:45 AM NY time) on intraday timeframes, designed for scalping and day trading.
Setup Requirements
Timeframe: Works on any timeframe under 15 minutes (1m, 2m, 3m, 5m, 10m)
Session: New York market hours
Range Period: 9:30-9:45 AM NY time (15-minute opening range)
Entry Rules
Long Entries:
Wait for a candle to close above the opening range high
Enter long on the next candle (before 12:00 PM NY time)
Must be above moving average if using MA-based take profit
Short Entries:
Wait for a candle to close below the opening range low
Enter short on the next candle (before 12:00 PM NY time)
Must be below moving average if using MA-based take profit
Risk Management
Stop Loss:
Long trades: Opening range low
Short trades: Opening range high
Take Profit Options:
Fixed Risk Reward: 1.5x the range size (customizable ratio)
Moving Average: Exit when price crosses back through MA
Both: Whichever comes first
Key Features
Trade Direction Options:
Long Only
Short Only
Both directions
Moving Average Filter:
Prevents entries that would immediately hit stop loss
Uses EMA/SMA/WMA/VWMA with customizable length
Acts as dynamic support/resistance
Time Restrictions:
No entries after 12:00 PM NY time (customizable cutoff)
One trade per direction per day
Daily reset of all variables
Visual Elements
Red/green lines showing opening range
Purple line for moving average
Entry and breakout signals with shapes
Take profit and stop loss levels plotted
Information table with current status
Strategy Logic Flow
Morning: Capture 9:30-9:45 range high/low
Wait: Monitor for breakout (previous candle close outside range)
Filter: Check MA condition if using MA-based exits
Enter: Trade on next candle after breakout
Manage: Exit at fixed TP, MA cross, or stop loss
Reset: Start fresh next trading day
This is a momentum-based breakout strategy that capitalizes on early market volatility while using the opening range as natural support/resistance levels.

Adaptive Multi-TF Indicator Table with Presets giua64📌 Script Name:
Adaptive Multi-Timeframe Indicator Table with Presets — giua64
📄 Description:
This script displays an adaptive multi-timeframe dashboard that summarizes the signals of three key technical indicators:
Moving Averages (MAs), Relative Strength Index (RSI), and MACD.
It provides a fast and visually intuitive overview of market conditions across five timeframes (5m, 15m, 30m, 1h, 4h), helping traders quickly identify potential directional biases (e.g., bullish, bearish, or neutral) based on either predefined presets or fully manual settings.
🧰 Preset Configurations:
You can choose between four trading styles, each with optimized indicator parameters:
Scalping
• MAs: 5 / 10 (Fast), 20 / 50 (Slow)
• RSI: 7 periods | Overbought: 70 | Oversold: 30
• MACD: 5 / 13 | Signal: 3
Intraday
• MAs: 9 / 21 (Fast), 50 / 100 (Slow)
• RSI: 14 periods | Overbought: 60 | Oversold: 40
• MACD: 12 / 26 | Signal: 9
Swing
• MAs: 10 / 20 (Fast), 50 / 200 (Slow)
• RSI: 14 periods | Overbought: 65 | Oversold: 35
• MACD: 12 / 26 | Signal: 9
Manual
• Full custom control over all indicator settings.
🛠️ All settings can be customized manually from the options panel, including the exact MA periods, RSI thresholds, and MACD structure.
🧠 How It Works:
For each timeframe, the script evaluates:
MA crossover status (two levels):
The first symbol refers to the crossover of the fast MAs
The second symbol refers to the crossover of the slow MAs
🟢 = Bullish crossover
🔴 = Bearish crossover
➖ = Flat or no clear signal
RSI Direction:
↑ = RSI above upper threshold (potential overbought)
↓ = RSI below lower threshold (potential oversold)
→ = RSI in neutral range
MACD Line vs Signal Line:
↑ = MACD line is above signal line (bullish)
↓ = MACD line is below signal line (bearish)
→ = Flat or neutral signal
Each signal is assigned a numerical score. These are aggregated per timeframe to compute a combined score that reflects the directional bias for that specific time window.
🧠 Adaptive Logic by Asset:
This script is designed to be universally compatible across all asset types — including forex, crypto, stocks, indices, and commodities.
Thanks to its multi-timeframe nature and flexible indicator presets, the script automatically adjusts its behavior based on the asset selected, ensuring relevant analysis without requiring manual recalibration.
🧾 Summary Table Output:
At the bottom of the dashboard, a combined sentiment is displayed for:
3TF → 5m, 15m, 30m
4TF → Adds 1h
5TF → Adds 4h
Each row shows:
Signal → LONG / SHORT / NEUTRAL
Confidence (%) → Based on score aggregation and signal consistency
📌 Customization Options:
Table Position: Left, Right, or Center
Text Size: Small, Normal, or Large
Full Manual Configuration: All MA, RSI, and MACD parameters can be adjusted as needed
⚠️ Disclaimer:
This script is for educational and analytical purposes only.
It does not constitute financial advice or guarantee any trading results.
Always do your own research and apply responsible risk management.

UM Dual MA with Price Bar Color change & Fill
Description
This is a dual moving average indicator with colored bars and moving averages. I wrote this indicator to keep myself on the right side of the market and trends. It plots two moving averages, (length and type of MA are user-defined) and colors the MAs green when trending higher or red when trending lower. The price bars are green when both MAs are green, red when both MAs are red, and orange when one MA is green and the other is red. The idea behind the indicator is to be extremely visual. If I am buying a red bar, I ask myself "why?" If I am selling a green bar, again, "why?"
Recommended Usage
Configure your tow favorite Moving averages. Consider long positions when one or both turn green. Scale into a position with a portion upon the first MA turning green, and then more when the second turns green. Consider scaling out when the bars are orange after an up move.
Orange bars are either areas of consolidation or prior to major turns.
You can also look for MA crossovers.
The indicator works on any timeframe and any security. I use it on daily, hourly, 2 day charts.
Default settings
The defaults are the author's preferred settings:
- 8 period WMA and 16 period WMA.
- Bars are green when both MAs are trending higher, red when both MAs are trending lower, and orange when one MA is trending higher and the other is trending lower.
Moving average types, lengths, and colors are user-configurable. Bar colors are also user-configurable.
Alerts
Alerts can be set by right-clicking the indicator and selecting the dropdown:
- Bullish Trend Both MAs turning green
- Bearish Trend Both MAs turning red
- Mixed Trend, 1 green 1 red MA
Helpful Hints:
Look for bullish areas when both MAs turn green after a sustained downtrend
Look for bearish areas when both MAs turn red
Careful in areas of orange bars, this could be a consolidation or a warning to a potential trend direction change.
Switch up your timeframes, I toggle back and forth between 1 and 2 days.
Stretch your timeframe over a lower time frame; for example, I like the 8 and 16 daily WMA. With most securities I get 16 bars with pre and post market. This translates into 128 and 256 MAs on the hourly chart. This slows down moves and color transitions for better manageability.
Author's Subjective Observations
I like the 128/256 WMA on the hourly charts for leveraged and inverse ETFs such as SPXL/SPXS, TQQQ/SQQQ, TNA/TZA. Or even the volatility ETFs/ETNS: UVXY, VXX.
Here is a one-hour chart example:
I have noticed that as volatility increases, I should begin looking at higher timeframes. This seems counterintuitive, but higher volatility increases the level of noise or swings.
I question myself when I short a green bar or buy a red bar; "Why am I doing this?" The colors help me visually stay on the right side of trend. If I am going to speculate on a market turn, at least do it when the bars are orange (MA trends differ)
My last observation is a 2-day chart of leveraged ETFs with the 8 and 16 WMAs. I frequently trade SPXL, FNGA, and TNA. If you are really dissecting this indicator,
look at a few 2-day charts. 2-day charts seem to catch the major swings nicely up and down. They also weed out the daily sudden big swings such as a panic move from economic data
or tweets. When both the MAs turn red on a 2-day chart the same day or same bar, beware; this could be a rough ride or short opportunity. I found weekly charts too long for my style but good
to review for direction. Less decisions on longer charts equate to less brain damage for myself.
These are just my thoughts, of course you do you and what suits your style best! Happy Trading.

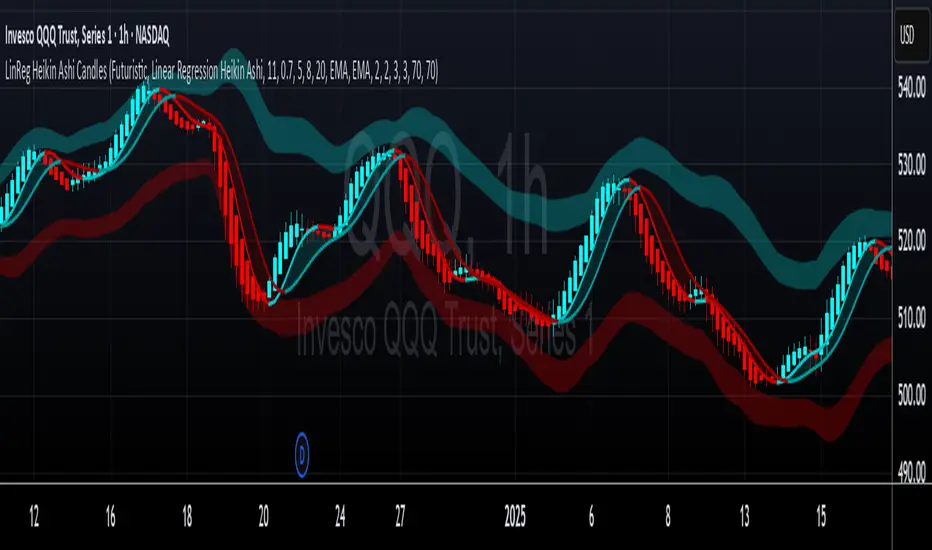
LinReg Heikin Ashi CandlesLinear Regression Heikin Ashi Candles will dramatically change how the candlesticks on your chart will appear. This script creates Heikin Ashi candles from the existing candlesticks and then applies wickless Linear Regression candles as an overlay. The result is an ultra smoothed 'Renko-like' chart that remains time-based and responsive.
Key Features:
Heikin Ashi Base: Provides a smoother representation of price trends by filtering out noise.
Linear Regression Candles on Heikin Ashi: Plots Linear Regression lines as candles on the Heikin Ashi chart, potentially highlighting the immediate trend direction and momentum within the smoothed data. Wicks are intentionally removed for a clearer focus on the linear progression.
Tillson T3 Moving Averages: Includes fast and slow T3 Moving Averages with customizable length and alpha. These smoothed moving averages can help identify trend direction and potential crossover signals. Users can toggle their visibility.
Volatility Bands: Integrates Volatility Bands based on Average True Range (ATR) with customizable length, ATR type (RMA, SMA, EMA, WMA), and inner/outer multipliers. These bands help gauge price volatility and potential reversal zones. Users can toggle the visibility of the basis line.
Customizable Colors: Allows users to customize the colors of the Linear Regression Heikin Ashi bullish and bearish candles.
How to Use:
This is an overlay on your chart so you'll need to 'hide' the existing candlesticks on your chart.
This indicator can be used on any timeframe from seconds to days to quickly identify market trend, gauge volatility, and potentially find entry/exit points. Consider looking for confluence between the candle color/direction, T3 MA crossovers, and price interaction with the Volatility Bands.
Note: This indicator plots Linear Regression directly on Heikin Ashi candles, removing wicks for a focus on the linear trend within the smoothed data. Adjust the input parameters to suit your trading style and the specific market conditions.
HUGE CREDIT to ugurvu who originally created the Linear Regression Candles indicator that my indicator pulls code from.
XAUUSD Multi-Timeframe Trend AnalyzerOverview
The "XAUUSD Multi-Timeframe Trend Analyzer" is an advanced script designed to provide a comprehensive analysis of the XAUUSD (Gold/US Dollar) trend across multiple timeframes simultaneously. By combining several key technical indicators, this tool helps traders quickly assess the market direction and trend strength for M15, M30, H1, H4, and D1 timeframes.
Multi-Timeframe Analysis: Displays the trend direction and strength across M15, M30, H1, H4, and D1 timeframes, allowing for a complete overview in a single glance.
Comprehensive Indicator Blend: Utilizes six popular technical indicators to determine the trend—Moving Averages, RSI, MACD, Bollinger Bands, DMI, and Parabolic SAR.
Trend Strength Scoring: Provides a numerical trend strength score (from -6 to 6) based on the alignment of the indicators, with positive values indicating uptrends and negative values for downtrends.
Visual Table Display: Displays results in a color-coded table (green for uptrend, red for downtrend, yellow for neutral) with a strength score for each timeframe, helping traders quickly assess market conditions.
How It Works
This script calculates the overall trend and its strength for each selected timeframe by analyzing six widely-used technical indicators:
Moving Averages (MA): The script uses a Fast and a Slow Moving Average. When the Fast MA crosses above the Slow MA, it indicates an uptrend. When the Fast MA crosses below, it signals a downtrend.
Relative Strength Index (RSI): The RSI is used to assess momentum. An RSI value above 50 suggests bullish momentum, while a value below 50 suggests bearish momentum.
Moving Average Convergence Divergence (MACD): MACD measures momentum and trend direction. When the MACD line crosses above the signal line, it signals bullish momentum; when it crosses below, it signals bearish momentum.
Bollinger Bands: These measure price volatility. When the price is above the middle Bollinger Band, the script considers the trend to be bullish, and when it's below, bearish.
Directional Movement Index (DMI): The DMI compares positive directional movement (DI+) and negative directional movement (DI-). A stronger DI+ over DI- signals an uptrend and vice versa.
Parabolic SAR: This indicator is used for determining potential trend reversals and setting stop-loss levels. If the price is above the Parabolic SAR, it indicates an uptrend, and if below, a downtrend.
Trend Strength Calculation
The script calculates a trend strength score for each timeframe:
Each indicator adds or subtracts 1 to the score based on whether it aligns with an uptrend or a downtrend.
A score of 6 indicates a Strong Uptrend, with all indicators aligned bullishly.
A score of -6 indicates a Strong Downtrend, with all indicators aligned bearishly.
Intermediate scores (e.g., 2 or -2) indicate Weak Uptrend or Weak Downtrend, suggesting that not all indicators are in agreement.
A score between 1 and -1 indicates a Neutral trend, suggesting uncertainty in the market.
How to Use
Assess Trend Direction and Strength: The table provides an easy-to-read summary of the trend and its strength on different timeframes. Look for timeframes where the strength is high (either 6 for a strong uptrend or -6 for a strong downtrend) to confirm the market’s overall direction.
Use in Conjunction with Other Strategies: This indicator is designed to provide a comprehensive view of the market. Traders should combine it with other strategies, such as price action analysis or candlestick patterns, to further confirm their trades.
Trend Reversal or Continuation: A weak trend (e.g., a strength of 2 or -2) could signal a possible reversal or a trend that has lost momentum. Strong trends (with a strength of 6 or -6) indicate higher confidence in trend continuation.
Multiple Timeframe Confirmation: Look for alignment across multiple timeframes to confirm the strength and direction of the trend before entering trades. For example, if M15, M30, and H1 are all showing a strong uptrend, it suggests a higher probability of the trend continuing.
Customization Options
- Adjustable Indicators: Users can modify the length and parameters of the Moving Averages, RSI, MACD, Bollinger Bands, DMI, and Parabolic SAR to suit their trading style.
- Flexible Timeframes: You can toggle between different timeframes (M15, M30, H1, H4, D1) to focus on the intervals most relevant to your strategy.
Ideal For
- Traders looking for a detailed, multi-timeframe trend analysis tool for XAUUSD.
- Traders who rely on trend-following strategies and need confirmation across multiple timeframes.
- Those who prefer a multi-indicator approach to avoid false signals and improve the accuracy of their trades.
Disclaimer
This indicator is for informational and educational purposes only. It is recommended to combine this with proper risk management strategies and your own analysis. Past performance does not guarantee future results. Always perform your own due diligence before making trading decisions.

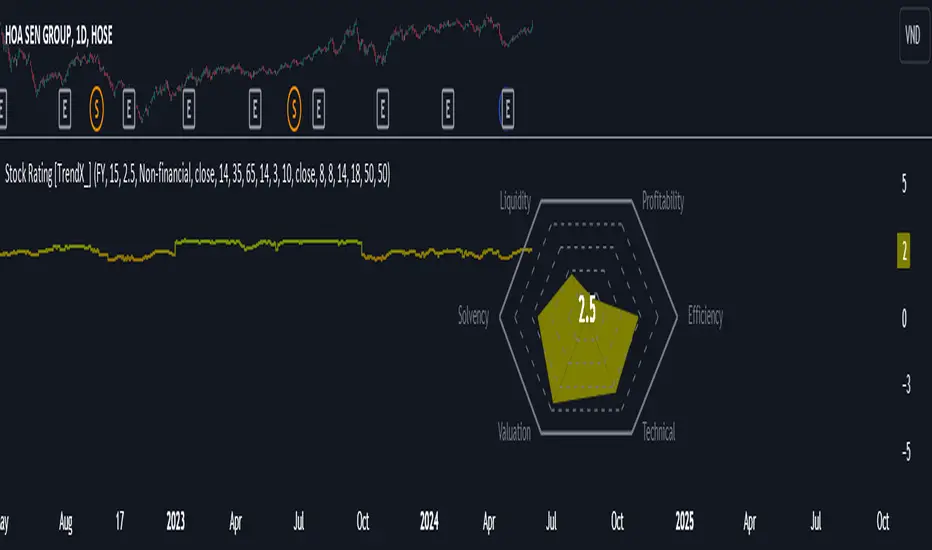
Stock Rating [TrendX_]# OVERVIEW
This Stock Rating indicator provides a thorough evaluation of a company (NON-FINANCIAL ONLY) ranging from 0 to 5. The rating is the average of six core financial metrics: efficiency, profitability, liquidity, solvency, valuation, and technical ratings. Each metric encompasses several financial measurements to ensure a robust and holistic evaluation of the stock.
## EFFICIENCY METRICS
1. Asset-to-Liability Ratio : Measures a company's ability to cover its liabilities with its assets.
2. Equity-to-Liability Ratio : Indicates the proportion of equity used to finance the company relative to liabilities.
3. Net Margin : Shows the percentage of revenue that translates into profit.
4. Operating Expense : Reflects the costs required for normal business operations.
5. Operating Expense Ratio : Compares operating expenses to total revenue.
6. Operating Profit Ratio : Measures operating profit as a percentage of revenue.
7. PE to Industry Relative PE/PB : Compares the company's PE ratio to the industry average.
## PROFITABILITY METRICS
1. ROA : Indicates how efficiently a company uses its assets to generate profit.
2. ROE : Measures profitability relative to shareholders' equity.
3. EBITDA : Reflects a company's operational profitability.
4. Free Cash Flow Margin : Shows the percentage of revenue that remains as free cash flow.
5. Revenue Growth : Measures the percentage increase in revenue over a period.
6. Gross Margin : Reflects the percentage of revenue exceeding the cost of goods sold.
7. Net Margin : Percentage of revenue that is net profit.
8. Operating Margin : Measures the percentage of revenue that is operating profit.
## LIQUIDITY METRICS
1. Current Ratio : Indicates the ability to cover short-term obligations with short-term assets.
2. Interest Coverage Ratio : Measures the ability to pay interest on outstanding debt.
3. Debt-to-EBITDA : Compares total debt to EBITDA.
4. Debt-to-Equity Ratio : Indicates the relative proportion of debt and equity financing.
## SOLVENCY METRICS
1. Altman Z-score : Predicts bankruptcy risk
2. Beneish M-score : Detects earnings manipulation.
3. Fulmer H-factor : Predicts business failure risk.
## VALUATION METRICS
1. Industry Relative PE/PB Comparison : Compares the company's PE and PB ratios to industry averages.
2. Momentum of PE, PB, and EV/EBITDA Multiples : Tracks the trends of PE, PB, and EV/EBITDA ratios over time.
## TECHNICAL METRICS
1. Relative Strength Index (RSI) : Measures the speed and change of price movements.
2. Supertrend : Trend-following indicator that identifies market trends.
3. Moving Average Golden-Cross : Occurs when a short-term MA crosses above mid-term and long-term MA which are determined by half-PI increment in smoothing period.
4. On-Balance Volume Golden-Cross : Measures cumulative buying and selling pressure.
Simplified MA Crossover indicatorThis is my first script, it is really simple logic and you probably saw something similar before. Is a crossover indicator between 2 Moving Average, one fast MA and the second slow MA.
Inputs you can adjust:
- 8 different source of MA's
- lenght of the MA's
- 7 different types of MA's ("EMA", "SMA", "RMA", "WMA", "DEMA", "TEMA", "HMA")
- 3 smoothing level of the fast MA
- plotting fast MA into the chart
- plotting crossover triangle shapes
I really enjoed the creation of this simple concept indicator, maybe not the fastest because of his nature but I liked work on it. I am sure is a good base to improve, study and try new idea.
Forex Multi-Factor IndicatorMoving Averages (MA):
Two moving averages are plotted on the chart: a fast MA (blue line) and a slow MA (red line).
The fast MA is calculated using a shorter period (10 periods by default), while the slow MA is calculated using a longer period (30 periods by default).
Moving averages help identify trends by smoothing out price fluctuations. When the fast MA crosses above the slow MA, it suggests a bullish trend, and when the fast MA crosses below the slow MA, it suggests a bearish trend.
Relative Strength Index (RSI):
The RSI indicator (orange line) is plotted on a separate axis.
RSI measures the speed and change of price movements and oscillates between 0 and 100.
RSI values above 70 are considered overbought, indicating a potential reversal to the downside, while RSI values below 30 are considered oversold, indicating a potential reversal to the upside.
Volume Moving Average (Volume MA):
The volume moving average (purple line) is plotted on the same axis as the volume.
The volume moving average is calculated over a specified period (20 periods by default).
Volume analysis provides insights into the strength of price movements. When the volume increases along with price movements, it suggests strong conviction from traders.
Buy and Sell Signals:
Buy signals (green triangle) are generated when all of the following conditions are met:
The fast MA crosses above the slow MA (indicating a bullish trend).
The RSI is below the oversold level (indicating potential upward momentum).
The current price is above the fast MA, and the volume is higher than the volume MA (indicating positive volume trend).
Sell signals (red triangle) are generated when all of the following conditions are met:
The fast MA crosses below the slow MA (indicating a bearish trend).
The RSI is above the overbought level (indicating potential downward momentum).
The current price is below the fast MA, and the volume is lower than the volume MA (indicating negative volume trend).
Overall, this multi-factor indicator combines moving averages, RSI, and volume analysis to identify potential buying and selling opportunities in the Forex market. Traders can use the signals generated by this indicator as part of their trading strategy, but it's important to consider other factors such as risk management and market conditions before making trading decisions

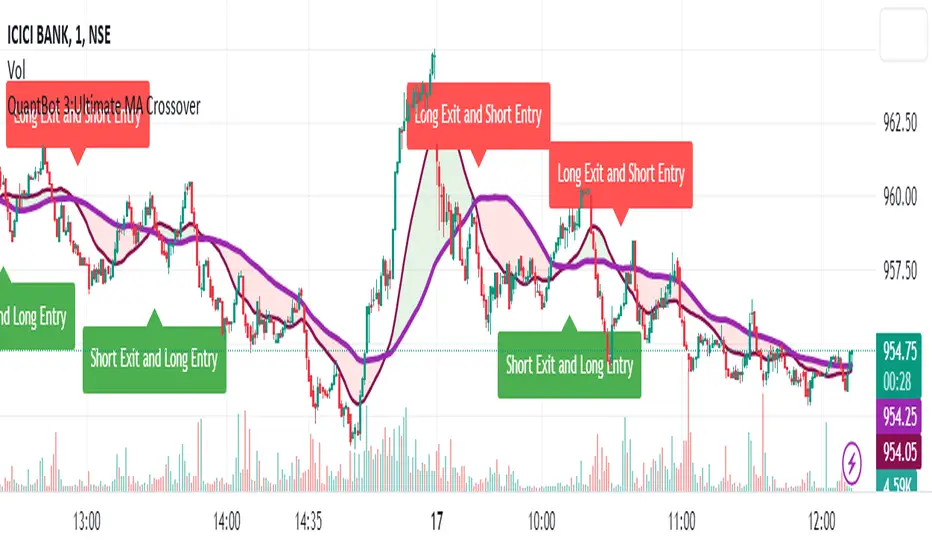
QuantBot 3:Ultimate MA CrossoverTHIS IS A SAMPLE CODE TO AUTOMATE WITH QUANTBOT
The moving average strategy is a popular and widely used technique in financial analysis and trading. It involves the calculation and analysis of moving averages, which are mathematical indicators that smooth out price data over a specified period. This strategy is primarily applied in the context of stock trading, but it can be used for other financial instruments as well.
The concept behind the moving average strategy is to identify trends and potential entry or exit points in the market. By calculating and analyzing moving averages of different timeframes, traders aim to capture the overall direction of the price movement and filter out short-term fluctuations or noise.
To implement the moving average strategy, a trader typically selects two or more moving averages with different periods. The most common combinations include the 50-day and 200-day moving averages. The shorter-term moving average is considered more reactive to price changes, while the longer-term moving average provides a smoother trend line. When the shorter-term moving average crosses above the longer-term moving average, it generates a buy signal, indicating a potential upward trend. Conversely, when the shorter-term moving average crosses below the longer-term moving average, it generates a sell signal, indicating a potential downward trend.
Traders can use various variations of the moving average strategy based on their trading objectives and risk tolerance. For instance, some traders may prefer to use exponential moving averages (EMAs) instead of simple moving averages (SMAs) to give more weight to recent price data. Others may incorporate additional indicators or filters to confirm signals or avoid false signals.
One of the strengths of the moving average strategy is its simplicity and ease of interpretation. It provides a clear visual representation of the trend direction and potential entry or exit points. However, it's important to note that the moving average strategy is a lagging indicator, meaning that it relies on past price data. Therefore, it may not always accurately predict future market movements or capture sudden reversals.
Like any trading strategy, the moving average strategy is not foolproof and carries risks. It is crucial for traders to conduct thorough analysis, consider other relevant factors, and manage their risk through proper position sizing and risk management techniques. Additionally, it's important to adapt the strategy to specific market conditions and combine it with other complementary strategies or indicators for improved decision-making.
Overall, the moving average strategy serves as a valuable tool for traders to identify and follow trends in financial markets, aiding in the analysis of price movements and potential trading opportunities.
TCG AI ToolsIntroduction:
This script is a result of an AI recommended created trading strategy that is design to offer new traders’ easy access to trend information and oversold/overbought conditions. Here we have combined commonly used indicators into a single unique visualization that quickly identifies trend changes and both RSI and Bollinger Band based overbought and oversold conditions, and allows all three indicators to be used simultaneously while taking up limited space on the chart.
The value in combining these three indicators is found in the harmony and clarity they are able to provide new traders. Trend changes can be difficult to identify based solely on candlestick analysis, therefore using the moving averages allows the trader to simplify the process of establishing bullish or bearish trends. Once a trend is established it can be very attractive for new traders to establish entries at the wrong time. For this reason, it is useful to include two different overbought and oversold indicators. The Bollinger Bands are included as one of the methods for establishing extreme prices that often result in reversals, and the relative strength index is similarly utilized as a second means to warn traders of extreme conditions.
Using the Indicator
1. MA10 MA20 Trend Indicator
The large red/green horizontal bar located at the 0 line on the X axis is the trend direction indicator. This visualization compares the 10 and 20 period moving averages to establish trend. When the MA10 is above the MA20 the trend is considered bullish and supportive of long positions and indicates such by changing the color of the horizontal bar to green. When the MA10 is below MA20 the trend is considered bearish and indicates such by changing the color of the horizontal bar to red. Color changes occur at the moment of a MA crossover/under.
2. Relative Strength Index.
The vertical red and green bars that make up the background of the panel indicate conditions wherein the RSI is considered overbought or oversold. When the vertical bar is red it indicates that RSI is below 30 suggesting that current conditions are oversold and supportive of long entries. When the vertical bar is green it suggests that the current conditions are overbought and are supportive of short entries.
3. Bollinger Band Extremes
Within the horizontal red/green bar there are red and green arrows. These arrows represent periods where the price is exceeding the upper or lower Bollinger bands and indicate overbought/oversold conditions. When a green arrow appears, it indicates that the price has crossed below the lower BB and is supportive of long entries. If a red arrow appears it indicates that the price has crossed above the upper Bollinger band and conditions are supportive of short entries.

RSI with Slow and Fast MA Crossing Strategy (by Coinrule)This strategy utilises 3 different conditions that have to be met to buy and 1 condition to sell. This strategy works best on the ETH/USDT pair on the 4-hour timescale.
In order for the strategy to enter the trade, it must meet all of the conditions listed below:
ENTRY
RSI increases by 5
RSI is lower than 70
MA9 crosses above MA50
To exit a trade, the below condition must be met:
EXIT
MA50 crosses above MA9
This strategy works well on LINK/USDT on the 1-day timeframe, MIOTA/USDT on the 2-hour timeframe, BTC/USDT on the 4-hour timeframe, and BEST/USDT on the 1-day timeframe (and 4h).
Back-tested from 1 January 2020.
The strategy assumes each order is using 30% of the available coins to make the results more realistic and to simulate you only ran this strategy on 30% of your holdings. A trading fee of 0.1% is also taken into account and is aligned to the base fee applied on Binance.

RSI + rCalcThis is a modification of the TradingView RSI.
I have added HMA and ALMA options to the MA settings and also the option for a colour change on RSI cross.
A reverse calc has also been added. This will display the MA cross/Overbought/Oversold price predictions. There is also the option to display an entered RSI or Price for a prediction display.
All colours and modifications can be turned on/off.
Enjoy! :)
MA VisualizerThe MA Visualizer is made up of 5 Moving Averages (MA)
All MA change color when the price closes above or below the MA line.
The background between the MA line and price will also change color, this creates the Visualizer.
When two or more MA are selected the two visualizer's will combine and create a gradient effect.
Each MA can be adjusted with 6 source selection's to choose from (SMA , EMA , WMA , HMA , RMA , WVMA).
The Visualizer can be turned off while leaving the MA lines turned on and vice versa.
Their is also a MA Cross indicator built-in.

Portfolio Backtester Engine█ OVERVIEW
Portfolio Backtester Engine (PBTE). This tool will allow you to backtest strategies across multiple securities at once. Allowing you to easier understand if your strategy is robust. If you are familiar with the PineCoders backtesting engine , then you will find this indicator pleasant to work with as it is an adaptation based on that work. Much of the functionality has been kept the same, or enhanced, with some minor adjustments I made on the account of creating a more subjectively intuitive tool.
█ HISTORY
The original purpose of the backtesting engine (`BTE`) was to bridge the gap between strategies and studies . Previously, strategies did not contain the ability to send alerts, but were necessary for backtesting. Studies on the other hand were necessary for sending alerts, but could not provide backtesting results . Often, traders would have to manage two separate Pine scripts to take advantage of each feature, this was less than ideal.
The `BTE` published by PineCoders offered a solution to this issue by generating backtesting results under the context of a study(). This allowed traders to backtest their strategy and simultaneously generate alerts for automated trading, thus eliminating the need for a separate strategy() script (though, even converting the engine to a strategy was made simple by the PineCoders!).
Fast forward a couple years and PineScript evolved beyond these issues and alerts were introduced into strategies. The BTE was not quite as necessary anymore, but is still extremely useful as it contains extra features and data not found under the strategy() context. Below is an excerpt of features contained by the BTE:
"""
More than `40` built-in strategies,
Customizable components,
Coupling with your own external indicator,
Simple conversion from Study to Strategy modes,
Post-Exit analysis to search for alternate trade outcomes,
Use of the Data Window to show detailed bar by bar trade information and global statistics, including some not provided by TV backtesting,
Plotting of reminders and generation of alerts on in-trade events.
"""
Before I go any further, I want to be clear that the BTE is STILL a good tool and it is STILL very useful. The Portfolio Backtesting Engine I am introducing is only a tangental advancement and not to be confused as a replacement, this tool would not have been possible without the `BTE`.
█ THE PROBLEM
Most strategies built in Pine are limited by one thing. Data. Backtesting should be a rigorous process and researchers should examine the performance of their strategy across all market regimes; that includes, bullish and bearish markets, ranging markets, low volatility and high volatility. Depending on your TV subscription The Pine Engine is limited to 5k-20k historical bars available for backtesting, which can often leave the strategy results wanting. As a general rule of thumb, strategies should be tested across a quantity of historical bars which will allow for at least 100 trades. In many cases, the lack of historical bars available for backtesting and frequency of the strategy signals produces less than 100 trades, rendering your strategy results inconclusive.
█ THE SOLUTION
In order to be confident that we have a robust strategy we must test it across all market regimes and we must have over 100 trades. To do this effectively, researchers can use the Portfolio Backtesting Engine (PBTE).
By testing a strategy across a carefully selected portfolio of securities, researchers can now gather 5k-20k historical bars per security! Currently, the PTBE allows up to 5 securities, which amounts to 25k-100k historical bars.
█ HOW TO USE
1 — Add the indicator to your chart.
• Confirm inputs. These will be the most important initial values which you can change later by clicking the gear icon ⚙ and opening up the settings of the indicator.
2 — Select a portfolio.
• You will want to spend some time carefully selecting a portfolio of securities.
• Each security should be uncorrelated.
• The entire portfolio should contain a mix of different market regimes.
You should understand that strategies generally take advantage of one particular type of market regime. (trending, ranging, low/high volatility)
For example, the default RSI strategy is typically advantageous during ranging markets, whereas a typical moving average crossover strategy is advantageous in trending markets.
If you were to use the standard RSI strategy during a trending market, you might be selling when you should be buying.
Similarily, if you use an SMA crossover during a ranging market, you will find that the MA's may produce many false signals.
Even if you build a strategy that is designed to be used only in a trending market, it is still best to select a portfolio of all market regimes
as you will be able to test how your strategy will perform when the market does something unexpected.
3 — Test a built-in strategy or add your own.
• Navigate to gear icon ⚙ (settings) of strategy.
• Choose your options.
• Select a Main Entry Strat and Alternate Entry Strat .
• If you want to add your own strategy, you will need to modify the source code and follow the built-in example.
• You will only need to generate (buy 1 / sell -1/ neutral 0) signals.
• Select a Filter , by default these are all off.
• Select an Entry Stop - This will be your stop loss placed at the trade entry.
• Select Pyamiding - This will allow you to stack positions. By default this is off.
• Select Hard Exits - You can also think of these as Take Profits.
• Let the strategy run and take note of the display tables results.
• Portfolio - Shows each security.
• The strategy runs on each asset in your portfolio.
• The initial capital is equally distributed across each security.
So if you have 5 securities and a starting capital of 100,000$ then each security will run the strategy starting with 20,000$
The total row will aggregate the results on a bar by bar basis showing the total results of your initial capital.
• Net Profit (NP) - Shows profitability.
• Number of Trades (#T) - Shows # of trades taken during backtesting period.
• Typically will want to see this number greater than 100 on the "Total" row.
• Average Trade Length (ATL) - Shows average # of days in a trade.
• Maximum Drawdown (MD ) - Max peak-to-valley equity drawdown during backtesting period.
• This number defines the minimum amount of capital required to trade the system.
• Typically, this shouldn’t be lower than 34% and we will want to allow for at least 50% beyond this number.
• Maximum Loss (ML) - Shows largest loss experienced on a per-trade basis.
• Normally, don’t want to exceed more than 1-2 % of equity.
• Maximum Drawdown Duration (MDD) - The longest duration of a drawdown in equity prior to a new equity peak.
• This number is important to help us psychologically understand how long we can expect to wait for a new peak in account equity.
• Maximum Consecutive Losses (MCL) - The max consecutive losses endured throughout the backtesting period.
• Another important metric for trader psychology, this will help you understand how many losses you should be prepared to handle.
• Profit to Maximum Drawdown (P:MD) - A ratio for the average profit to the maximum drawdown.
• The higher the ratio is, the better. Large profits and small losses contribute to a good PMD.
• This metric allows us to examine the profit with respect to risk.
• Profit Loss Ratio (P:L) - Average profit over the average loss.
• Typically this number should be higher in trend following systems.
• Mean reversion systems show lower values, but compensate with a better win %.
• Percent Winners (% W) - The percentage of winning trades.
• Trend systems will usually have lower win percentages, since statistically the market is only trending roughly 30% of the time.
• Mean reversion systems typically should have a high % W.
• Time Percentage (Time %) - The amount of time that the system has an open position.
• The more time you are in the market, the more you are exposed to market risk, not to mention you could be using that money for something else right?
• Return on Investment (ROI) - Your Net Profit over your initial investment, represented as a percentage.
• You want this number to be positive and high.
• Open Profit (OP) - If the strategy has any open positions, the floating value will be represented here.
• Trading Days (TD) - An important metric showing how many days the strategy was active.
• This is good to know and will be valuable in understanding how long you will need to run this strategy in order to achieve results.
█ FEATURES
These are additional features that extend the original `BTE` features.
- Portfolio backtesting.
- Color coded performance results.
- Circuit Breakers that will stop trading.
- Position reversals on exit. (Simulating the function of always in the market. Similar to strategy.entry functionality)
- Whipsaw Filter
- Moving Average Filter
- Minimum Change Filter
- % Gain Equity Exit
- Popular strategies, (MACD, MA cross, supertrend)
Below are features that were excluded from the original `BTE`
- 2 stage in-trade stops with kick-in rules (This was a subjective decision to remove. I found it to be complex and thwarted my use of the `BTE` for some time.)
- Simple conversion from Study to Strategy modes. (Not possible with multiple securities)
- Coupling with your own external indicator (Not really practical to use with multiple securities, but could be used if signals were generated based on some indicator which was not based on the current chart)
- Use of the Data Window to show detailed bar by bar trade information and global statistics.
- Post Exit Analysis.
- Plotting of reminders and generation of alerts on in-trade events.
- Alerts (These may be added in the future by request when I find the time.)
█ THANKS
The whole PineCoders team for all their shared knowledge and original publication of the BTE and Richard Weismann for his ideas on building robust strategies.
═════════════════════════════════════════════════════════════════════════
